What this calculator does
Mean, median, and mode answer three different questions about the same list. The mean asks what each value would be if the total were shared equally. The median asks which value sits in the middle. The mode asks which value appears most often. Reading them together is more useful than picking one, because a gap between the mean and the median is the quickest signal that the data is skewed.
How to use it
- Type the values into the box, separated by commas.
- Include at least one number; decimals and negatives are accepted.
- Read the mean, median, mode, count, and range.
- Compare the mean and median to judge how skewed the list is.
- Clear the box and enter a new list to start over.
How it works
Example calculations
Example 1: 2, 4, 4, 6, 8
The sum is 24 and the count is 5, so the mean is 4.8. Sorted, the middle value is 4, so the median is 4. The value 4 appears twice, so the mode is 4. The range is 8 - 2, or 6.
Example 2: 1, 2, 3, 4, 5
The sum is 15 and the count is 5, so the mean is 3, and the median is also 3. No value repeats, so there is no mode. The range is 4. A balanced list with no repeats is why the mean and median line up.
Example 3: 10, 12, 12, 14, 15, 15
The sum is 78 and the count is 6, so the mean is 13. The two middle values are 12 and 14, so the median is 13. Both 12 and 15 appear twice, so the list is bimodal, and the range is 5.
What the result means
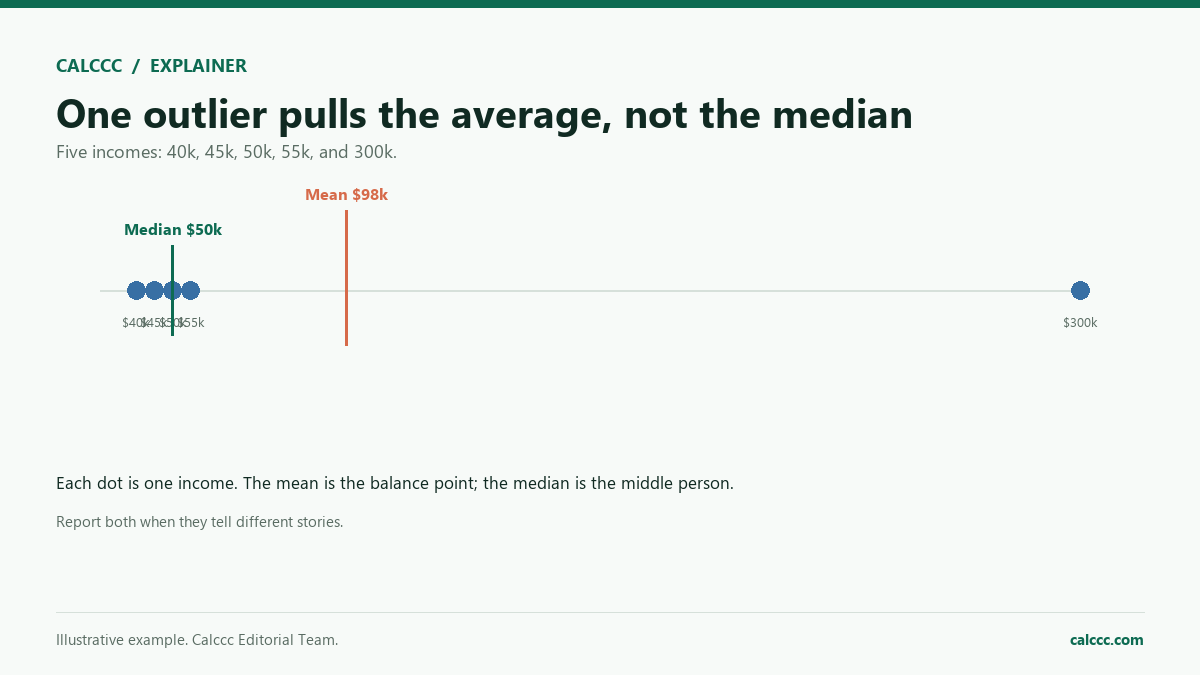
The mean is the most familiar summary and the most sensitive to extreme values. Ten values clustered near 50 plus a single value of 500 pull the mean well above the median. The median resists that pull, which is why it is used for incomes, home prices, and other skewed measures. The mode is the only one of the three that works for labels as well as numbers, such as the most common shoe size in an order. Range is a crude spread, because it uses only two values and ignores everything between them. Together they give a quick profile of a list, but they do not show shape, and two very different lists can share the same mean, median, and mode.
Common mistakes
- Forgetting to sort the list before finding the median.
- Treating a list with no repeated value as having a mode of zero.
- Letting one extreme value stand in for the typical case.
- Using the range as a full measure of spread.
- Mixing units, such as dollars and counts, in one list.
Assumptions and limits
- Values are real numbers, and commas separate them.
- Blank entries and trailing commas are ignored.
- The median is taken from the sorted list, not the entered order.
- Every value tied for the highest frequency is reported as a mode.
- A list where no value repeats has no mode.
Frequently asked questions
What if two values tie for most frequent?
Both are modes and the list is bimodal. The calculator reports every value that shares the top count instead of choosing one arbitrarily.
Can the mean and median be the same?
Yes, and symmetric lists often have them equal. A list like 1, 2, 3, 4, 5 has a mean and median of 3. A large gap between the two signals skew.
Is the mode useful for numbers?
It is most useful for repeated values such as sizes, ratings, or counts. For continuous measurements many values appear only once, so the mode may not exist.
How is the range calculated?
Subtract the smallest value from the largest. It is a quick spread measure, but it depends on only two values, so a single outlier can inflate it.
Does the order I type the numbers in matter?
No. The mean, median, mode, count, and range come out the same. The median is calculated from the sorted version of your list.
What does the count include?
Every valid number in the list. Blanks and stray commas are skipped, so a trailing comma does not inflate the count.
Sources
2026 update
How to use the professional output
This page is not just a formula box. The result is designed to be checked, compared, and taken away.
- Professional worksheet. The result includes the inputs used, the method and scope, and a one-variable sensitivity check for finance calculators.
- A/B scenarios. Save two input sets in the browser and compare the primary, secondary, and breakdown figures side by side.
- Print / PDF and CSV. Print a branded worksheet, or export the year-by-year table when the calculator produces one.
The formulas and assumptions above still govern the number. The worksheet makes the estimate auditable; it does not make it a lender quote, tax return, or personalized advice.
Part of a decision center
Math Decision Center
See the companion tools, decision guides, and patterns that go with this calculator.
Go deeper