


Key takeaways
- Mean = sum ÷ count; median = middle value.
- One extreme value can move the mean a lot and the median very little.
- Use the median for “typical” values in skewed data.
- Use the mean when every value should count equally in a total.
- Report both when the difference matters.
A simple example
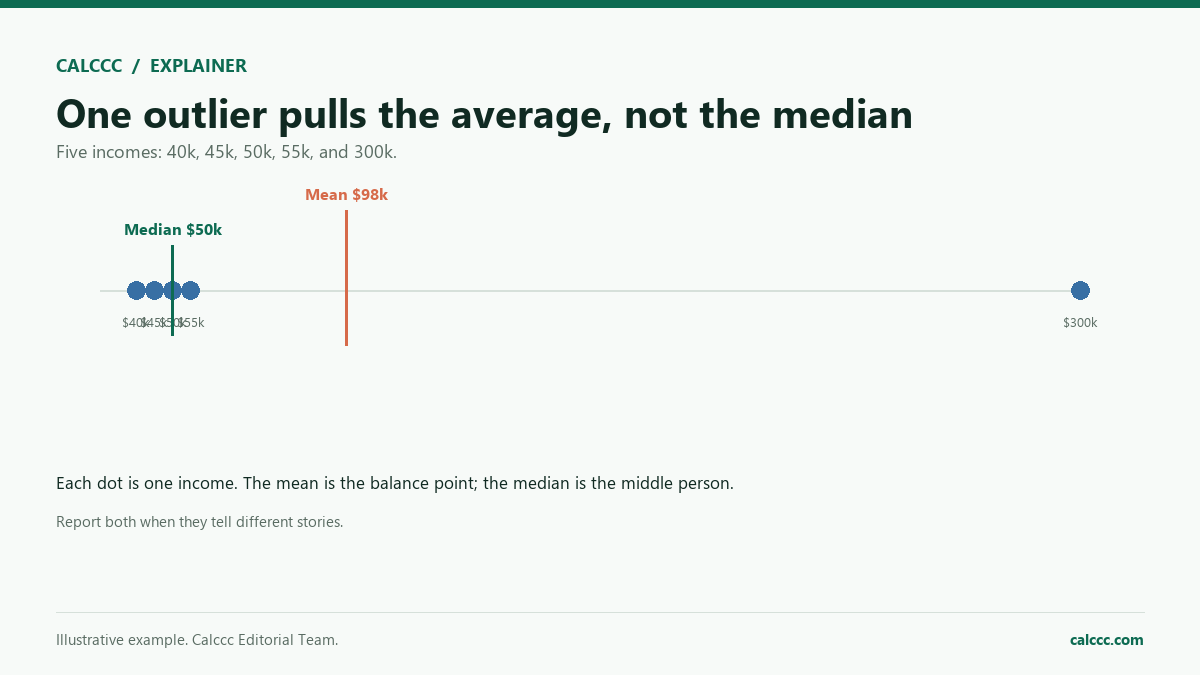
Five coworkers earn $40,000, $45,000, $50,000, $55,000, and $300,000. The mean is ($40k + $45k + $50k + $55k + $300k) ÷ 5 = $98,000. The median is $50,000, the middle value. Which is more “typical”? The median, because one very high salary pulls the average up.
| Measure | Result | What it tells you |
|---|---|---|
| Mean | $98,000 | Total payroll divided by five |
| Median | $50,000 | Middle earner; less affected by the outlier |
| Mode | No repeat | Most common value; not useful here |
How to calculate each one
Mean: add all values, divide by the number of values. Median: sort the values; if the count is odd, take the middle; if even, average the two middle values. Mode: the value that appears most often.
For 2, 4, 4, 7, 9: mean = 26 ÷ 5 = 5.2; median = 4; mode = 4. For 1, 2, 3, 4: median = (2 + 3) ÷ 2 = 2.5.
When the mean is the right choice
- You need a total or a per-unit rate: total revenue ÷ number of customers.
- The data is roughly symmetric and has no extreme outliers.
- Every observation should carry equal weight in the calculation.
- You are calculating a grade average where all scores count equally.
When the median is the right choice
- Incomes, wealth, house prices, and other skewed data.
- One or two extreme values could distort the mean.
- You want the “typical” observation, not the mathematical balance point.
- You are comparing a typical household with an average that includes billionaires.
Mean, median, and mode in real life
Average test scores are usually means because every score counts. Household income is usually reported as a median because high incomes skew the mean. House prices are often reported as medians for the same reason. Customer ratings may use a mean, but a median can be more robust when one angry outlier appears.
“Average” is not a synonym for “typical.” Averages are useful, but they can hide the shape of the data.
Weighted averages
A weighted average gives different values different importance. If a student scores 90 on a test worth 40% of the grade and 80 on a final worth 60%, the weighted average is 0.4 × 90 + 0.6 × 80 = 84. A simple mean of 85 would be wrong because the final counts more. Weighted averages are common in grades, portfolio returns, and survey results.
The median does not have a simple weighted version in the same way. If some observations represent more people or more dollars, say so and use a weighted mean, or report the distribution separately. Also check the spread: two data sets can have the same mean and median but very different ranges. A high standard deviation means the values are more spread out; a low one means they cluster near the center. Report the spread when the difference between mean and median is meaningful.
2026 calculator update: what changed
The linked calculator has been upgraded. It now includes a professional worksheet with the inputs used, the method and scope, and a one-variable sensitivity check for finance tools. You can save two input sets as Scenarios A/B and compare the results side by side. The Print / PDF action produces a branded worksheet, and table-producing calculators can export a CSV.
When the mean misleads
The mean uses every value and is sensitive to outliers. The median is the middle value and is resistant to extremes. In a small dataset, one very large value can raise the mean far above the median. That does not make the mean wrong; it answers a different question.
An example
Five salaries: $40,000, $45,000, $50,000, $55,000, and $200,000. The mean is $78,000; the median is $50,000. The mean describes total payroll divided by five, but the median describes the typical salary better. Report both when the distribution is skewed.
What to compare
Compare the mean, median, range, and outliers. For skewed data, the median is often the better “typical” value; the mean is better for totals.
Report both mean and median when the distribution is skewed.
Check both.
Now.
Now check.
Frequently asked questions
Is average the same as mean?
In everyday use, yes. In statistics, “average” can refer to mean, median, or mode, so it is better to name the measure.
Which is more accurate?
Neither is universally more accurate. The right measure depends on the question and the data distribution.
Why is median income lower than mean income?
High incomes pull the mean upward. The median is the middle household, so it is less affected by the tail.
What if there are two modes?
The data is bimodal. Report both modes or use another measure; a single mode may be misleading.
How we checked this guide
We calculated the mean and median by hand for the examples and compared them with the calculator’s output. The income example is illustrative. The guidance on skewed data follows standard descriptive-statistics practice.
Further reading
Keep exploring
Decision path