


Key takeaways
- The mortgage payment is not the full cost of owning.
- Closing and selling costs make short stays expensive.
- Rent growth and home appreciation drive the long-run comparison.
- The down payment has an opportunity cost.
- Run a pessimistic case, not only the optimistic one.
Start with the full monthly cost
A mortgage payment usually includes principal and interest. Owning also brings property tax, homeowners insurance, maintenance, and sometimes HOA dues. A common planning rule is to set aside about 1% of the home’s value per year for maintenance, though the right reserve depends on the age and condition of the house.
Rent looks simpler because one payment covers the unit. But rent can increase every year, and the renter does not build equity. The comparison is not “mortgage versus rent”; it is “total cost of owning versus total cost of renting, including what happens to the cash.”
Closing and selling costs
Buying has upfront costs: lender fees, title, appraisal, recording, and prepaid escrow items. Selling has its own costs, often 6% or more for commission and closing. If you buy and sell within a few years, those costs can exceed the equity you build. That is why a short horizon often favors renting.
Equity is not cash in hand
Equity is the home value minus what you owe and minus selling costs. A $450,000 home that rises 3% a year is worth about $604,000 after ten years. If you still owe $280,000 and pay 6% to sell, your net equity is roughly $288,000. That is real wealth, but it is not the same as $288,000 in a savings account.
Owning also provides a place to live, which has value beyond investment returns. Renting provides flexibility. Those non-financial factors belong in the decision.
Opportunity cost
The down payment and closing cash could be invested. If that money earns 5% instead, the renter has an investment balance the buyer does not. A fair comparison includes that forgone return. It does not mean renting always wins; it means the down payment is not free.
What changes the answer
Longer stays favor buying because closing costs are spread over more years and more of each payment goes to principal. Faster rent growth favors buying. Faster home appreciation favors buying. Higher maintenance, taxes, or selling costs favor renting. A flat housing market can make renting look better for a long time.
A worked example
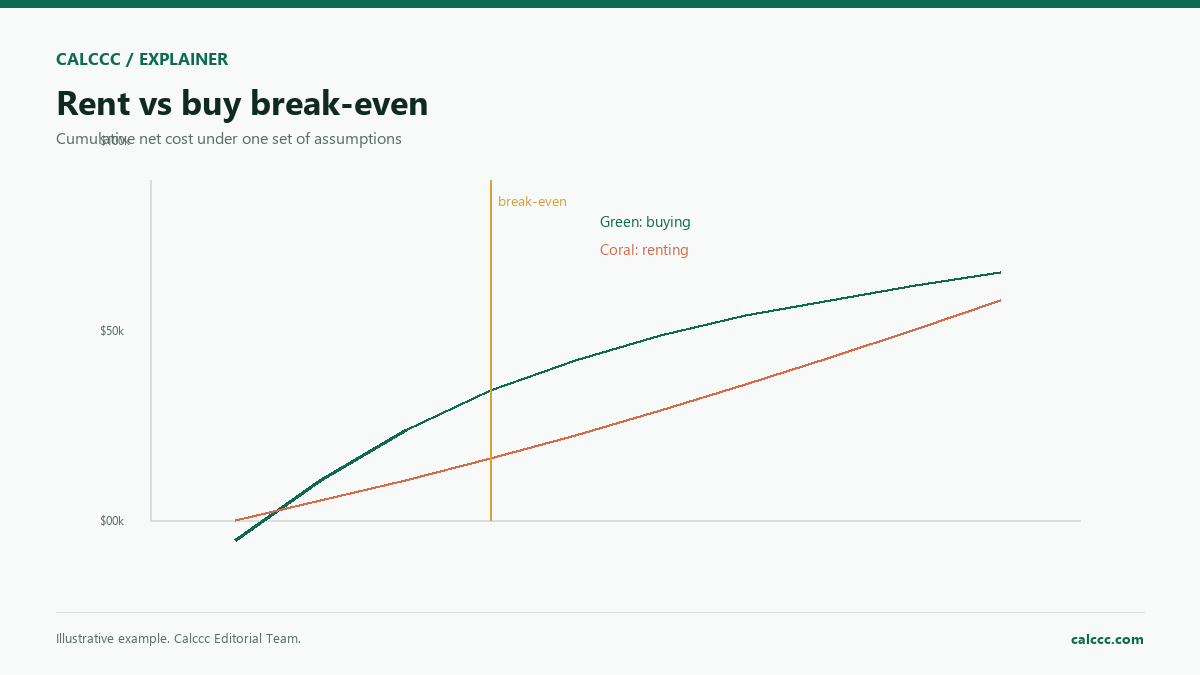
Assume a $450,000 home, 20% down, a 6.5% 30-year mortgage, 1.2% property tax, $1,800 insurance, 1% maintenance, 3% appreciation, 3% closing costs, 6% selling costs, $2,200 rent growing 3% a year, and a 5% return on invested cash. Over ten years, the model shows buying cheaper on net, with a break-even around year four. Change the assumptions and the answer moves.
Why the first years look expensive
Early mortgage payments are weighted toward interest, while closing costs are paid up front. That combination makes the first two or three years of owning look worse than the monthly payment suggests. A buyer who sells quickly may recover less than the cash invested. A renter avoids those transaction costs but gives up any price appreciation.
The comparison should also include the cost of moving itself. Whether you rent or buy, moving has a price. If buying requires a longer commute or a second car, those costs belong in the budget too.
What a break-even year means
The break-even year is not a guarantee that buying is better from that point onward. It is the first year the model’s cumulative net cost of buying is no higher than renting under one set of assumptions. If home prices stall or rent growth slows, the line can move. Treat it as a sensitivity tool, not a finish line.
Frequently Asked Questions
Does buying always beat renting?
No. It depends on the horizon, transaction costs, price growth, rent growth, and the return on the cash used to buy.
How long should I stay to make buying worthwhile?
There is no universal number. Many rules of thumb say five to seven years, but the right answer depends on your local market and costs.
Should I include maintenance?
Yes. A reserve of about 1% of value per year is a common planning starting point, but older homes and major systems can require more.
Is rent money wasted?
No. Rent buys housing and flexibility. The question is whether the alternative use of the same cash produces a better outcome for your situation.
2026 professional upgrade: HOA, PMI, and a real comparison table
The Calccc rent vs buy calculator now includes HOA and PMI, a monthly ownership composition chart, and a year-by-year table with net buy, net rent, the difference, and equity. The monthly owning cost is separated from the rent so you can see which line item is driving the result.
Use the comparison horizon, appreciation, rent growth, maintenance, transaction costs, and investment return together. The break-even year is a model output, not a prediction; change one assumption at a time and save the two versions as A/B scenarios.
How we checked this guide
We built the comparison from the same cash-flow assumptions used in the calculator and checked the arithmetic by hand. The model is an educational scenario, not a forecast or a recommendation.
2026 calculator update: what changed
The linked calculator has been upgraded. It now includes a professional worksheet with the inputs used, the method and scope, and a one-variable sensitivity check for finance tools. You can save two input sets as Scenarios A/B and compare the results side by side. The Print / PDF action produces a branded worksheet, and table-producing calculators can export a CSV.
The page also explains why a bank, lender, broker, or provider can quote a different number: rate versus APR, fees, credit pricing, taxes, insurance, and timing. Use the written quote or Loan Estimate as the binding document, not the calculator estimate.
Further reading
Keep exploring
Decision path