


Key takeaways
- A1C is a percentage; eAG is a glucose value.
- The formula is 28.7 × A1C − 46.7 for mg/dL.
- mmol/L is mg/dL divided by 18.
- Standard categories are screening labels, not diagnoses.
- Anemia, pregnancy, and kidney disease can affect A1C.
Why A1C exists
A single glucose reading is a snapshot. A1C reflects the percentage of hemoglobin that has glucose attached over the life of red blood cells, which is about two to three months. That makes it useful for tracking long-term control rather than one meal.
Because many people think in meter numbers, the eAG conversion translates the percentage into an average glucose value. It answers the question “what average glucose does this A1C roughly correspond to?”
The conversion
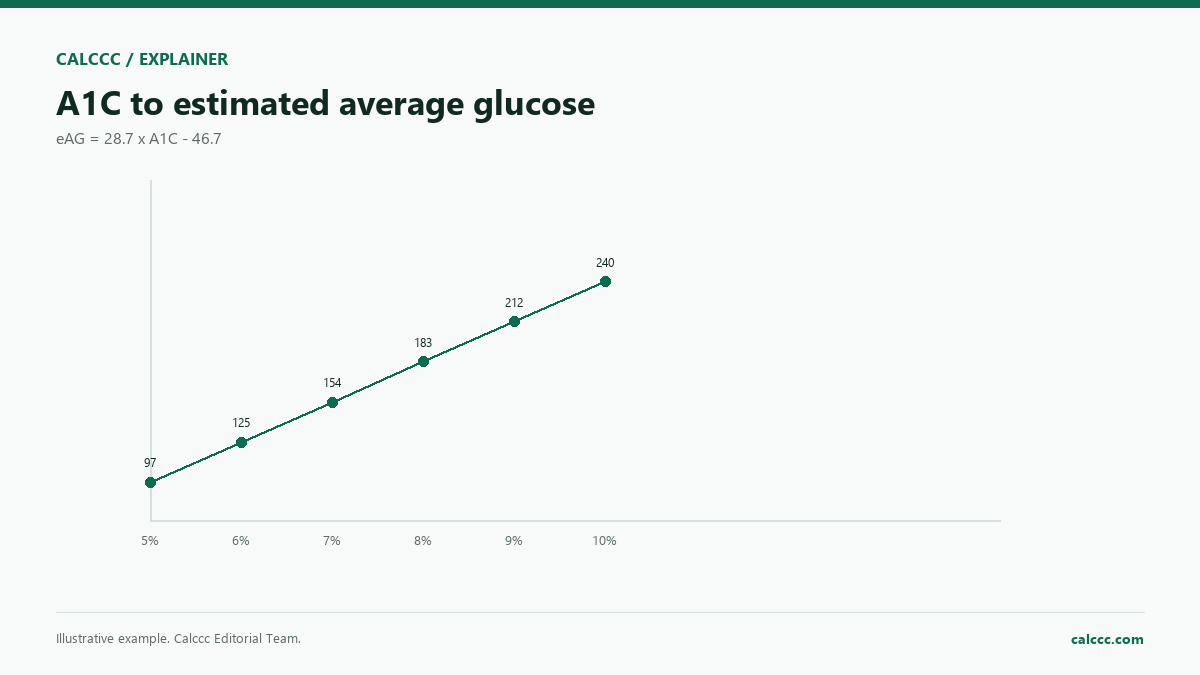
For A1C 7%, eAG is 28.7 × 7 − 46.7 = 154.2 mg/dL, or about 8.6 mmol/L. For A1C 6%, eAG is about 126 mg/dL. The relationship is linear in the formula, but individual averages can differ from the population average.
Categories
Standard adult categories label A1C below 5.7% as normal, 5.7–6.4% as prediabetes, and 6.5% or higher as the diabetes range. These are screening categories. Diagnosis requires clinical context and usually a confirmatory test.
Targets are personal. A clinician may recommend a higher target for an older adult at risk of hypoglycemia or a lower target for a younger person with a long life expectancy. The label is not the treatment plan.
When A1C can mislead
Conditions that change red blood cell lifespan or hemoglobin can shift A1C. Anemia, recent blood loss, pregnancy, kidney disease, and some hemoglobin variants are examples. In those cases, glucose monitoring or another measure may be more reliable.
A1C versus daily monitoring
A1C shows the big picture, while daily monitoring shows the peaks and valleys. Two people with the same A1C can have very different daily patterns. Someone with frequent highs and lows may have the same average as someone with steadier readings. A clinician may use both to adjust treatment.
Home monitoring also helps identify how food, activity, stress, and sleep affect glucose. The A1C cannot tell you which meal caused a spike. The meter cannot tell you the long-term average. Together they are more useful than either alone.
What can change the result
Red blood cells live about three months, so a recent blood loss or transfusion can make A1C look lower than the true average. Iron deficiency, kidney disease, and some hemoglobin variants can shift the result in either direction. Pregnancy changes red blood cell turnover and glucose targets, so pregnancy-specific criteria apply.
Using the calculator well
Enter the value from a lab report or a home A1C test, not a guess. If you have an eAG from a continuous monitor, the conversion gives an approximate A1C. Do not use the result to change medication without a clinician. Bring the number, the date, and your monitoring log to the appointment.
What to ask at the appointment
Ask what your personal target is, how often to test, and whether the A1C should be confirmed with another test. Ask how your medicines, meals, and activity affect the number. A single A1C is a conversation starter, not a complete treatment plan.
If your A1C and your meter average disagree, mention it. A clinician may check for anemia, kidney disease, or a hemoglobin variant, or review whether the meter and test strips are working correctly.
Keep a record
Write down the A1C value, the date, and the lab or device. If you use a home test, note the brand and lot number. A trend over several tests is more informative than a single percentage, and the record makes the next appointment more useful.
Frequently Asked Questions
Is eAG the same as my meter average?
It is an estimate. Your meter average may differ because of testing times, meter accuracy, and individual red blood cell turnover.
Can I diagnose diabetes from A1C alone?
A1C is used in diagnosis, but a clinician confirms with repeat testing and context. Do not self-diagnose from one result.
What is a good A1C?
Targets vary by person. Many adults aim for less than 7%, but older adults or people with hypoglycemia risk may have different goals.
Does A1C change quickly?
It reflects a long average, so it moves slowly. A change in the last two weeks may not show fully.
How we checked this guide
We compared the formula and categories with CDC, NIDDK, and MedlinePlus guidance and checked the example conversions. The article is educational, not medical advice.
Estimated average glucose
eAG (mg/dL) = 28.7 × A1C − 46.7. An A1C of 7% corresponds to an eAG of about 154 mg/dL. The formula is an estimate; individual red blood cell lifespan and conditions such as anemia can affect A1C. Use it as a conversation tool with a clinician, not a diagnosis.
What to compare
Compare the A1C, the eAG, and the glucose log. A single number does not capture variability.
2026 calculator update: what changed
The linked calculator has been upgraded. It now includes a professional worksheet with the inputs used, the method and scope, and a one-variable sensitivity check for finance tools. You can save two input sets as Scenarios A/B and compare the results side by side. The Print / PDF action produces a branded worksheet, and table-producing calculators can export a CSV.
For health tools, the worksheet makes the inputs and assumptions visible, but it does not replace a clinician. Use the print view when you want to discuss the result with a professional.
Further reading