What this calculator does
The salary is only part of the cost of an employee. Employer taxes, benefits, insurance, equipment, office space, and management overhead can add 30–50% or more. This calculator makes the full cost visible for budgeting and pricing.
How to use it
- Enter the annual salary.
- Enter the employer payroll tax rate.
- Add annual benefits and insurance.
- Add an overhead allocation as a percentage of salary.
- Enter paid hours per week and annual PTO days.
- Review the total cost and cost per productive hour.
How it works
Example calculations
Example: $70,000 salary
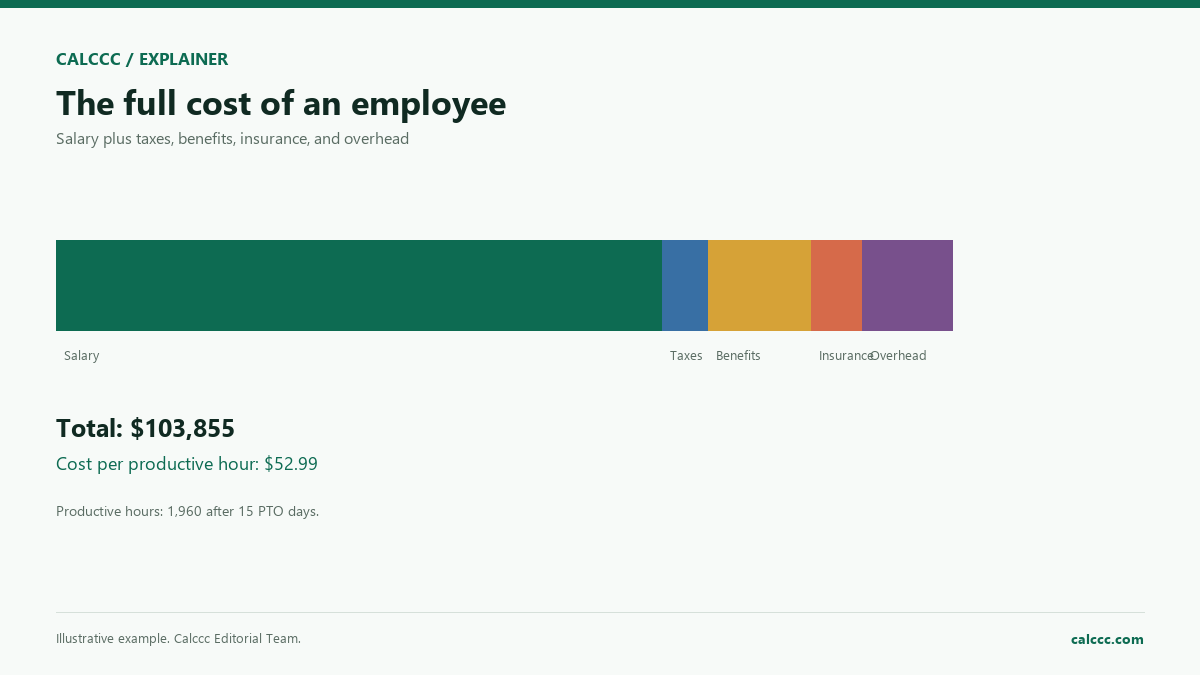
With 7.65% employer payroll tax, $12,000 benefits, $6,000 insurance, 15% overhead, 40 paid hours, and 15 PTO days, the total is about $103,855, or $52.99 per productive hour.
Why overhead matters
A 15% overhead allocation adds $10,500. Without it, the cost is understated.
What the result means
Employer costs vary widely by country, state, benefits package, and remote-work arrangement. Use actual rates and include equipment, software, recruiting, and training if they are material. For pricing, the cost per productive hour is often more useful than salary alone.
Common mistakes
- Comparing salary offers without benefits and taxes.
- Forgetting PTO in productive hours.
- Ignoring recruiting, equipment, and training.
- Applying a single overhead rate to every role.
Assumptions and limits
- Salary is the base.
- Payroll tax is a percentage of salary.
- Benefits and insurance are annual amounts.
- Overhead is a percentage of salary.
- PTO reduces productive hours.
Frequently asked questions
What is a typical overhead rate?
It varies by industry and workplace. Use your accounting data rather than a generic rule.
Should I include recruiting costs?
For a first-year budget, yes. Recruiting and training can be significant.
Is cost per hour the same as a billable rate?
No. A billable rate must also cover profit, non-billable time, and business development.
Sources
2026 update
How to use the professional output
This page is not just a formula box. The result is designed to be checked, compared, and taken away.
- Professional worksheet. The result includes the inputs used, the method and scope, and a one-variable sensitivity check for finance calculators.
- A/B scenarios. Save two input sets in the browser and compare the primary, secondary, and breakdown figures side by side.
- Print / PDF and CSV. Print a branded worksheet, or export the year-by-year table when the calculator produces one.
The formulas and assumptions above still govern the number. The worksheet makes the estimate auditable; it does not make it a lender quote, tax return, or personalized advice.
Part of a decision center
Tax & Paycheck Center
See the companion tools, decision guides, and patterns that go with this calculator.
Go deeper