What this calculator does
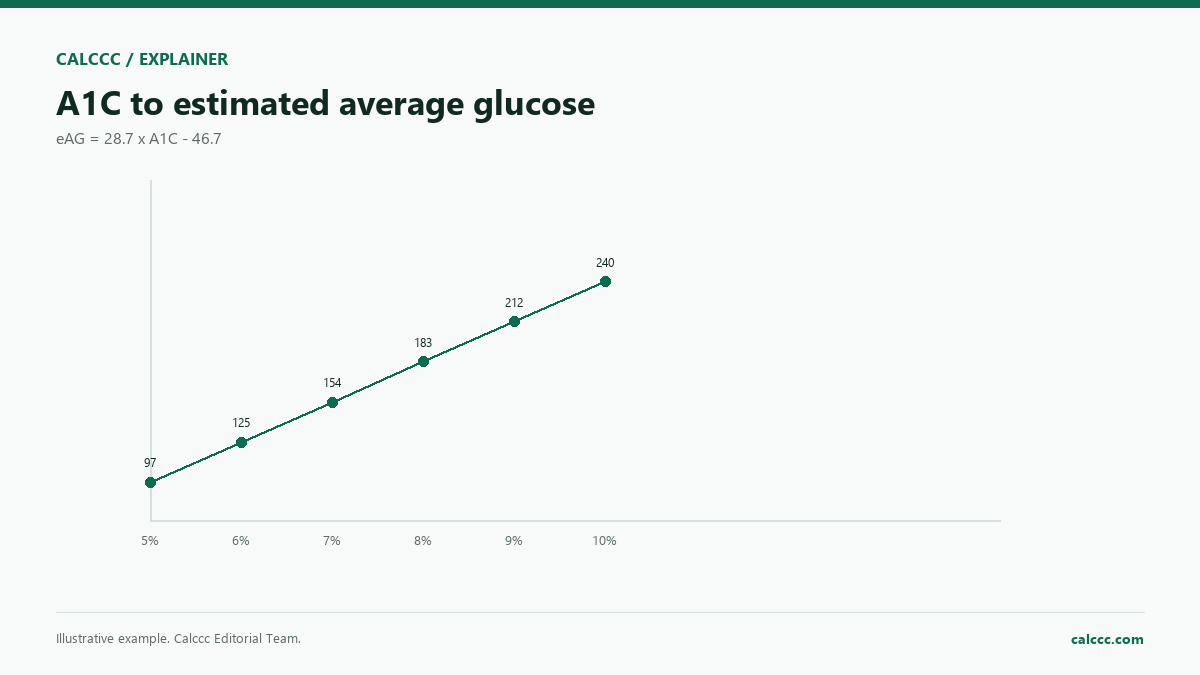
A1C reflects average blood glucose over roughly the previous two to three months. The estimated average glucose (eAG) translates A1C into the same units used on a meter. The conversion is useful for context, not for diagnosis.
How to use it
- Choose whether you have an A1C or an average glucose value.
- Enter the value.
- Read the converted result in mg/dL and mmol/L.
- Review the category label.
- Discuss targets with a clinician.
How it works
Example calculations
Example: A1C 7%
eAG is about 154 mg/dL or 8.6 mmol/L, which is in the diabetes range under standard categories.
Example: eAG 126 mg/dL
The corresponding A1C is about 6.0%, in the prediabetes range.
What the result means
The formula is a population average. Individual meter averages can differ because of hemoglobin variants, anemia, kidney disease, pregnancy, and other conditions. A1C targets are personal; older adults and people with hypoglycemia risk may have different goals.
Common mistakes
- Using the conversion to diagnose diabetes.
- Assuming eAG matches every meter reading.
- Ignoring conditions that affect A1C.
- Treating one number as a treatment target.
Assumptions and limits
- The A1C is a percentage.
- eAG is in mg/dL or mmol/L.
- The standard formula is used.
- Categories are screening labels, not diagnoses.
- Pregnancy and some conditions need different interpretation.
Frequently asked questions
What is eAG?
Estimated average glucose: the average glucose level that corresponds to an A1C.
Is A1C the same as a glucose meter reading?
No. A1C is a long-term average; a meter reading is a point-in-time value.
What A1C is diabetes?
Standard categories use 6.5% or higher, but diagnosis should be confirmed by a clinician.
Can A1C be misleading?
Yes, in pregnancy, anemia, kidney disease, and some hemoglobin variants.
Sources
2026 update
How to use the professional output
This page is not just a formula box. The result is designed to be checked, compared, and taken away.
- Professional worksheet. The result includes the inputs used, the method and scope, and a one-variable sensitivity check for finance calculators.
- A/B scenarios. Save two input sets in the browser and compare the primary, secondary, and breakdown figures side by side.
- Print / PDF and CSV. Print a branded worksheet, or export the year-by-year table when the calculator produces one.
The formulas and assumptions above still govern the number. The worksheet makes the estimate auditable; it does not make it a lender quote, tax return, or personalized advice.
Go deeper